Understanding when and how customers use bricks-and-mortar stores can lead to a wealth of operational efficiencies, says Mark King, Sensormatic Solutions’ market development director for the UK and Ireland …
How does your customer-tracking technology work, and what sort of information does it generate?
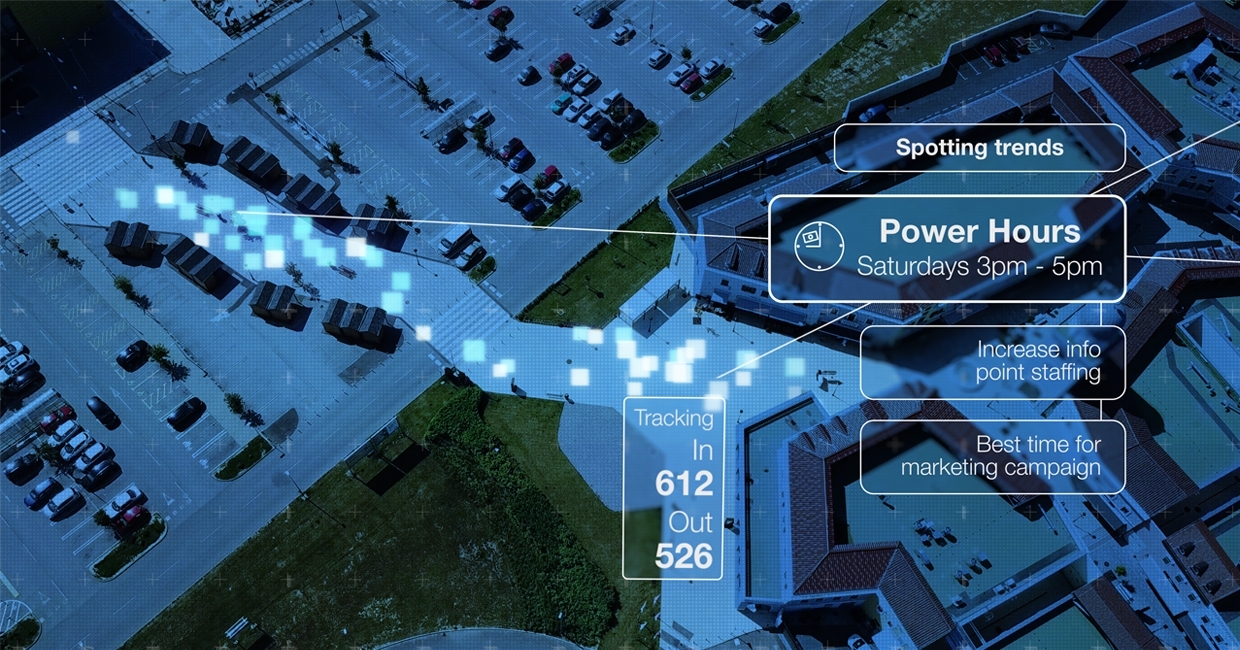
Our Sensormatic Traffic Analytics solution collects and delivers data that retailers can easily convert into meaningful insights and actionable outcomes. From people-counting devices at store entrances to location-based technologies monitoring shopper movement, our solution can build a comprehensive picture of the shopper journey and customer behaviour inside diverse retail spaces.
Our offer consists of three major building blocks: a full analytics suite, offering comprehensive insights delivered via intuitive dashboards or customised reports, including peak traffic times, traffic patterns, conversion rates and many other key store operation metrics – the data can be extended by third-party insights and inputs from other devices/sensors to offer a unique and personalised view of a retail space and its customers;
benchmarking data – people-counting insights to benchmark performance of a group of stores against the rest of the market by geography or sub-vertical, in order to understand the performance of your stores at the city, region or country level; and trusted advisory services – whether in the form of retail consulting practice or dedicated consumer success managers, the team of experts help retailers gain additional insights, understand the wealth of data and take actions that will drive the greatest business impact.
How can retailers benefit from the insights your technology offers? Can you offer some concrete examples?
It is difficult to manage what you cannot measure. Therefore, it all starts with the accurate, real-time counting of the visitors entering a retail space and their behaviour.
From there, retailers can find answers to questions such as: When are the peak time for the visitors? What are our busiest days and power hours? What are our conversion rates? Are our staffing strategies in line with our visitor flow? Do we have enough labour coverage during power hours?
How does a shopper journey inside our store looks like? Are our storefront and shopping windows drawing enough attention? How do shoppers move within a store? Can we utilise our space better, improve store layouts and increase profits?
As an example, one of the customers wanted to create a so-called ‘journey map’ in order to optimise merchandising strategies and improve floor planning. They tested how seasonal floor changes affected the consumer experience, and which store areas were acting as ‘dead zones’. They also tested how consumers are engaging with digital content, ads and in-store displays.
The results helped them to rearrange the store layout and merchandise setup in the upcoming season.
How has the pandemic affected the demand for and delivery of your services in the UK?
The pandemic has caught many retailers off guard, without a proper solution to measure new safety measures that either became obligatory for a period or were implemented to put consumer safety concerns at ease.
We were able to support many customers at this difficult time by implementing innovative solutions, such as analytics on occupancy limits, social distance measuring, mask detection, etc. Trading in a post-pandemic world has changed brick-and-mortar retailing – now, more than ever, stores must deliver the experience shoppers are demanding. This has highlighted to retailers that they need more data to successfully engage with their customers, and the very basic starting block is to understand when and how many customers come into the stores.
How might in-store tracking tie in with a retailer’s ecommerce strategy?
Traffic data can support a retailer’s ecommerce strategy in multiple ways. One of them is the measurement of the effectiveness of online marketing and promotions.
It is great to run a promotional campaign, – for example, offering a 10% discount for an in-store purchase during a particular week – but one also needs to know if such a campaign actually drove people to the store. Were those predominantly new customers, or loyal brand ambassadors? In this case, visitor frequency traffic patterns can be correlated to promotional strategies and provide insights into the impact of the campaign on store/chain KPIs.
Have you worked with any clients in UK furniture retail, and can you share anything about your experiences?
Sensormatic work with the majority of furniture retailers in the UK and have a full understanding of the very different engagement large-ticket, considered purchases require.
Some furniture retailers use conversion rate as a store KPI and will reward staff accordingly, while others use it as a measure across the varying store classifications to gain more insight around general performance, adding this data to the econometric modelling. Both models require consistent and accurate data, and that is why they choose Sensormatic.
Due to our extensive reach and the wealth of data gathered in the furniture segment in the UK, since January we’ve been able to offer an exclusive market intelligence index dedicated to home furnishings in the UK. This index enables the benchmarking of the performance of a store or a group of stores against the rest of the market, and creates a direct understanding of how a specific in-store’s traffic compares to similar businesses in the UK.
Read more about customer tracking solutions in the March 2022 issue of Furniture News.